


Master the Bart Pattern: Insights into Crypto Chart Analysis

Crypto Chart Patterns: Identifying Common Crypto Chart Formations
Cryptocurrency trading involves making educated predictions about future price movements, and while no method can guarantee accuracy, chart patterns have emerged as valuable tools for traders seeking to understand market behavior. These recognizable formations on price graphs help traders assess risk, identify key price levels, and make informed decisions when navigating the volatile crypto market. By studying historical patterns, including the bart trading pattern and other formations that precede significant price movements in cryptocurrencies like Bitcoin and Ethereum, traders can develop strategies to improve their trading outcomes.
What Are Crypto Chart Patterns?
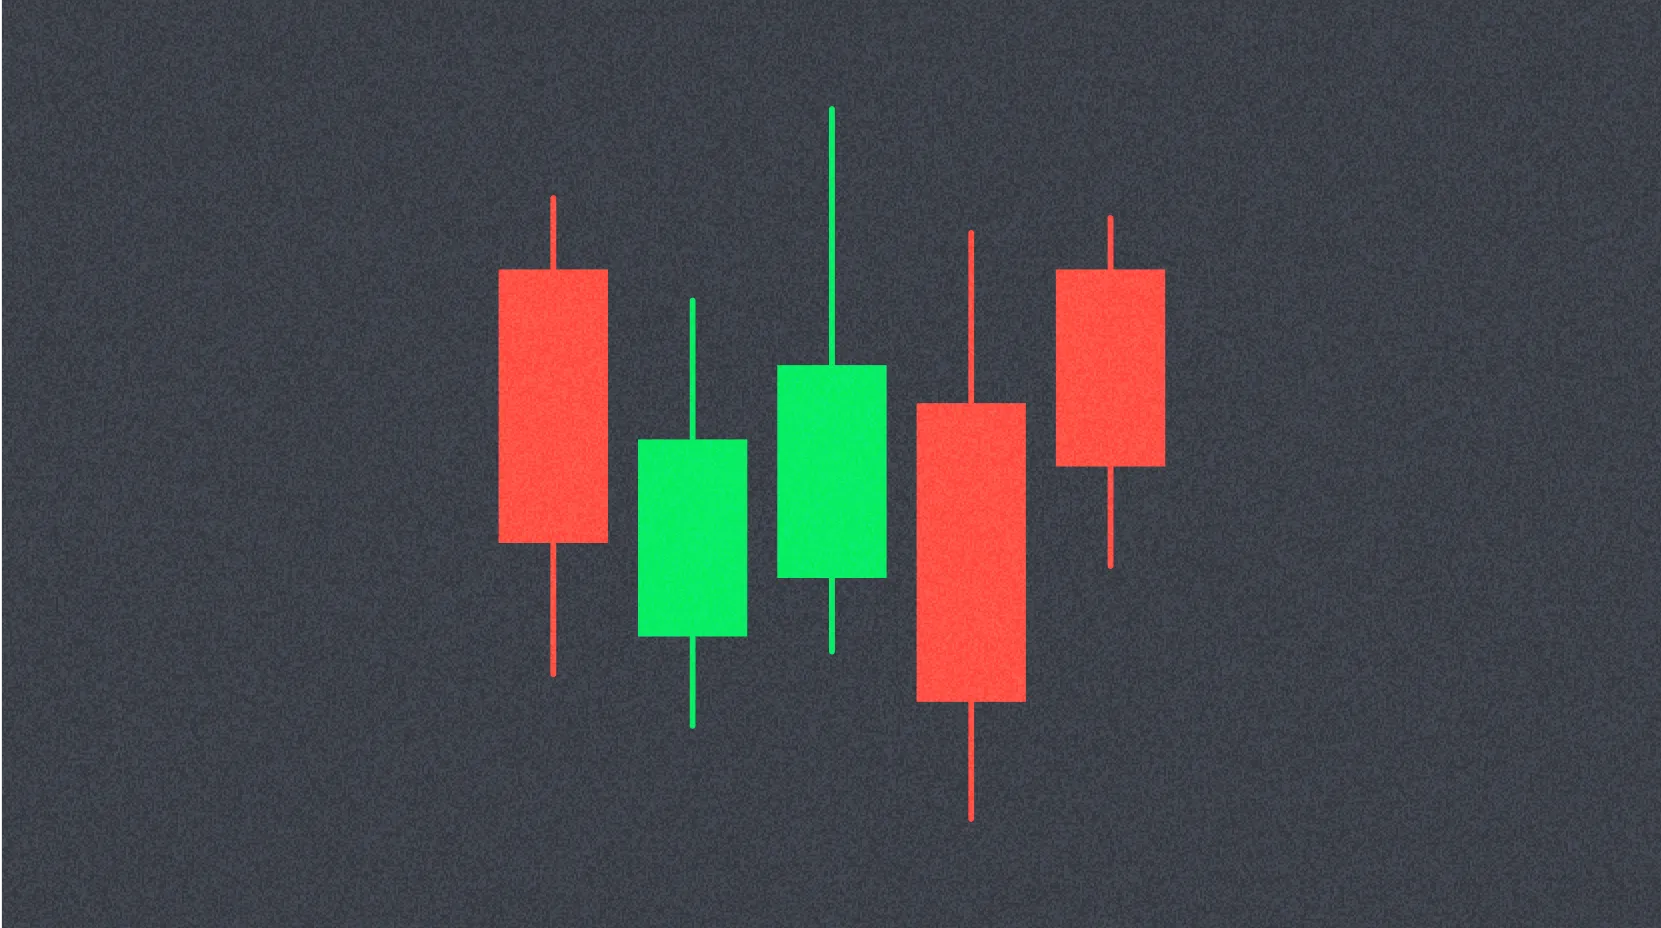
Crypto chart patterns are identifiable formations or shapes that appear on cryptocurrency price graphs, which traders utilize to analyze market psychology and forecast potential future price movements. As a fundamental component of technical analysis, these patterns focus on visual price data rather than fundamental metrics such as market capitalization or token supply. Traders examine candlestick chart patterns to identify well-documented formations, including the distinctive bart trading pattern, that historically indicate bullish (upward), bearish (downward), or sideways price action. By recognizing these patterns, traders gain insights into market sentiment and can better anticipate how prices might behave in the near future.
Benefits and Risks of Analyzing Candlestick Chart Patterns
Analyzing crypto chart patterns offers both advantages and limitations that traders must consider when incorporating them into their trading strategies.
The primary benefits include the ability to define precise price levels for entering and exiting positions. Chart patterns help traders visualize optimal prices for opening trades and setting stop-loss and take-profit orders, which removes emotional decision-making from the trading process. Additionally, these patterns provide valuable probability indicators about market sentiment and directional bias. When combined with other technical indicators and fundamental analysis, chart patterns enable traders to develop comprehensive trading theses. Furthermore, once traders become familiar with basic formations, these patterns become easy to spot, with some major exchange platforms offering software tools to assist in pattern identification.
However, significant risks accompany pattern analysis. The most notable limitation is the inconsistency of results—chart patterns are probability indicators rather than guaranteed predictions, and cryptocurrencies frequently move in unexpected directions. Interpretive errors are common because pattern recognition is highly subjective; different traders may identify different patterns or reach varying conclusions depending on their experience level and chosen timeframes. Moreover, relying solely on chart patterns neglects fundamental analysis, meaning traders may miss critical information about network upgrades, tokenomics changes, or other fundamental events that could significantly impact prices and invalidate identified patterns.
How to Identify Crypto Trading Patterns: A Few Tips
Identifying crypto chart patterns requires a systematic approach similar to meteorological cloud analysis. Rather than searching for random shapes, traders must first learn the characteristics of established patterns such as bull flags, bear flags, double tops, and the bart trading pattern, along with their typical implications. This foundational knowledge enables traders to scan current price graphs and make calculated decisions based on recognized formations.
Successful pattern identification involves focusing on well-established formations rather than projecting novel images onto price charts. As traders interpret patterns, they must calculate their risk-return profile, determining how much capital they're willing to risk for potential profits. Experienced traders always define their maximum loss potential using protective orders like stop-losses, which automatically exit losing positions. By establishing clear risk and reward parameters before entering trades, traders add predictability and discipline to their trading approach, acknowledging that patterns, like weather forecasts, don't always predict outcomes accurately.
Crypto Patterns Cheat Sheet: Common Crypto Graph Patterns to Know
Several chart patterns have become standard knowledge among cryptocurrency traders, each with distinct characteristics and implications.
Bull and bear flags begin with a strong directional candlestick (green for bullish, red for bearish) called the "flagpole," followed by a brief consolidation period forming the "flag." Traders expect prices to continue in the flagpole's direction, with bull flags suggesting upward movement and bear flags indicating potential declines.
Ascending triangles form when prices consistently post higher lows while encountering resistance at a horizontal level, creating a triangular shape with an upward bias. Descending triangles display the opposite pattern, with prices hitting lower highs while maintaining a support level, typically suggesting downward momentum.
The head and shoulders pattern resembles its namesake, featuring two rounded "shoulders" with the highest price point (the "head") in the center. This formation typically signals a local top and potential selloff when prices break below the pattern's "neckline." An inverted head and shoulders pattern suggests a bullish breakout.
Double top formations occur when prices reach the same peak twice with an intermediate decline, warning of potential bearish reversals, especially if support levels fail. Conversely, double bottoms touch two similar lows with a rally between them, typically indicating bullish trend reversals.
The cup and handle pattern appears during uptrends, resembling a teacup. The "cup" forms when prices hit resistance, decline, and rise back to resistance. The "handle" develops when prices fall approximately one-third the cup's length before rising toward resistance again. This pattern typically signals bullish continuation, with traders expecting further upward movement.
The bart trading pattern is a distinctive formation named after the cartoon character Bart Simpson's head silhouette. This pattern features a sharp, sudden price movement (either upward or downward) that creates a vertical line, followed by a flat horizontal consolidation period, and then an equally sharp reversal back to near the original price level. The bart trading pattern resembles a square wave or inverted "L" shape and is particularly common in cryptocurrency markets. Traders often associate the bart trading pattern with low liquidity conditions or potential market manipulation, as the abrupt price movements and reversals suggest artificial volatility rather than organic market dynamics. When identifying the bart trading pattern, traders typically exercise caution, as it may indicate unstable market conditions where traditional support and resistance levels become less reliable.
Conclusion
Crypto chart patterns serve as valuable tools in a trader's analytical toolkit, providing visual frameworks for understanding market psychology and predicting potential price movements. While these patterns offer significant benefits—including defined entry and exit points, probability assessments, and ease of identification—traders must acknowledge their limitations, particularly inconsistent results and subjective interpretation. Success in pattern-based trading requires combining technical pattern recognition with fundamental analysis, proper risk management, and realistic expectations. By studying common formations like flags, triangles, head and shoulders, double tops or bottoms, and distinctive patterns like the bart trading pattern, traders can develop more informed strategies for navigating cryptocurrency markets. However, it's crucial to remember that chart patterns are probability indicators rather than guarantees, and disciplined risk management through tools like stop-loss orders remains essential for long-term trading success.
FAQ
What is the Bart pattern in trading?
The Bart pattern is a price formation resembling Bart Simpson's hair, with a sharp rise followed by a quick drop. It often signals a potential market reversal.
What is the most successful trading pattern?
The most successful patterns include Head and Shoulders, Double Top/Bottom, Triangle, Cup and Handle, and Flag/Pennant. High volume during breakouts is key for confirmation.
What does bart mean in trading?
In trading, a BART pattern refers to a price manipulation tactic. It involves a sudden price pump followed by a sharp drop, designed to trick traders into buying at inflated prices.
What is the Bart Simpson method?
The Bart Simpson method is a trading pattern named after a popular video. It's caused by large institutional buyers creating significant price movements, used to identify market trends.
Top Decentralized Exchange Aggregators for Optimal Trading

Understanding FOMO in Crypto and Transforming It into Weekly Opportunities

Mastering Stop Limit Order Strategy in Cryptocurrency Trading

Understanding Crypto Slippage: A Clear Explanation

Top Crypto Trading Simulation Tools for Beginners

Understanding FUD in the Crypto World

What is BULLA coin: analyzing whitepaper logic, use cases, and team fundamentals in 2026

How does MYX token's deflationary tokenomics model work with 100% burn mechanism and 61.57% community allocation?

What Are Derivatives Market Signals and How Do Futures Open Interest, Funding Rates, and Liquidation Data Impact Crypto Trading in 2026?

How do futures open interest, funding rates, and liquidation data predict crypto derivatives market signals in 2026?

What is a token economics model and how does GALA use inflation mechanics and burn mechanisms
