

Search Token/Wallet
Understanding the Cycles of Cryptocurrency Through the History of Crypto Winters
2026-11-04 07:34
Bitcoin
Bitcoin Halving
Cryptocurrency market
Investing In Crypto
Macro Trends
Article Rating : 3
156 ratings
The article delves into the cyclical nature of the cryptocurrency market, emphasizing the theory of crypto cycles and their impact on trading strategies, particularly during periods known as crypto winters. It provides insights into the four phases of the crypto cycle—consolidation, markup, distribution, and markdown—and how understanding these can benefit traders. The discussion explores how historical patterns, such as Bitcoin halvings, influence market dynamics and trader psychology, offering tools and indicators to aid in market phase identification. Ultimately, this piece is designed to equip long-term investors with strategies to navigate market fluctuations and optimize investment timing.
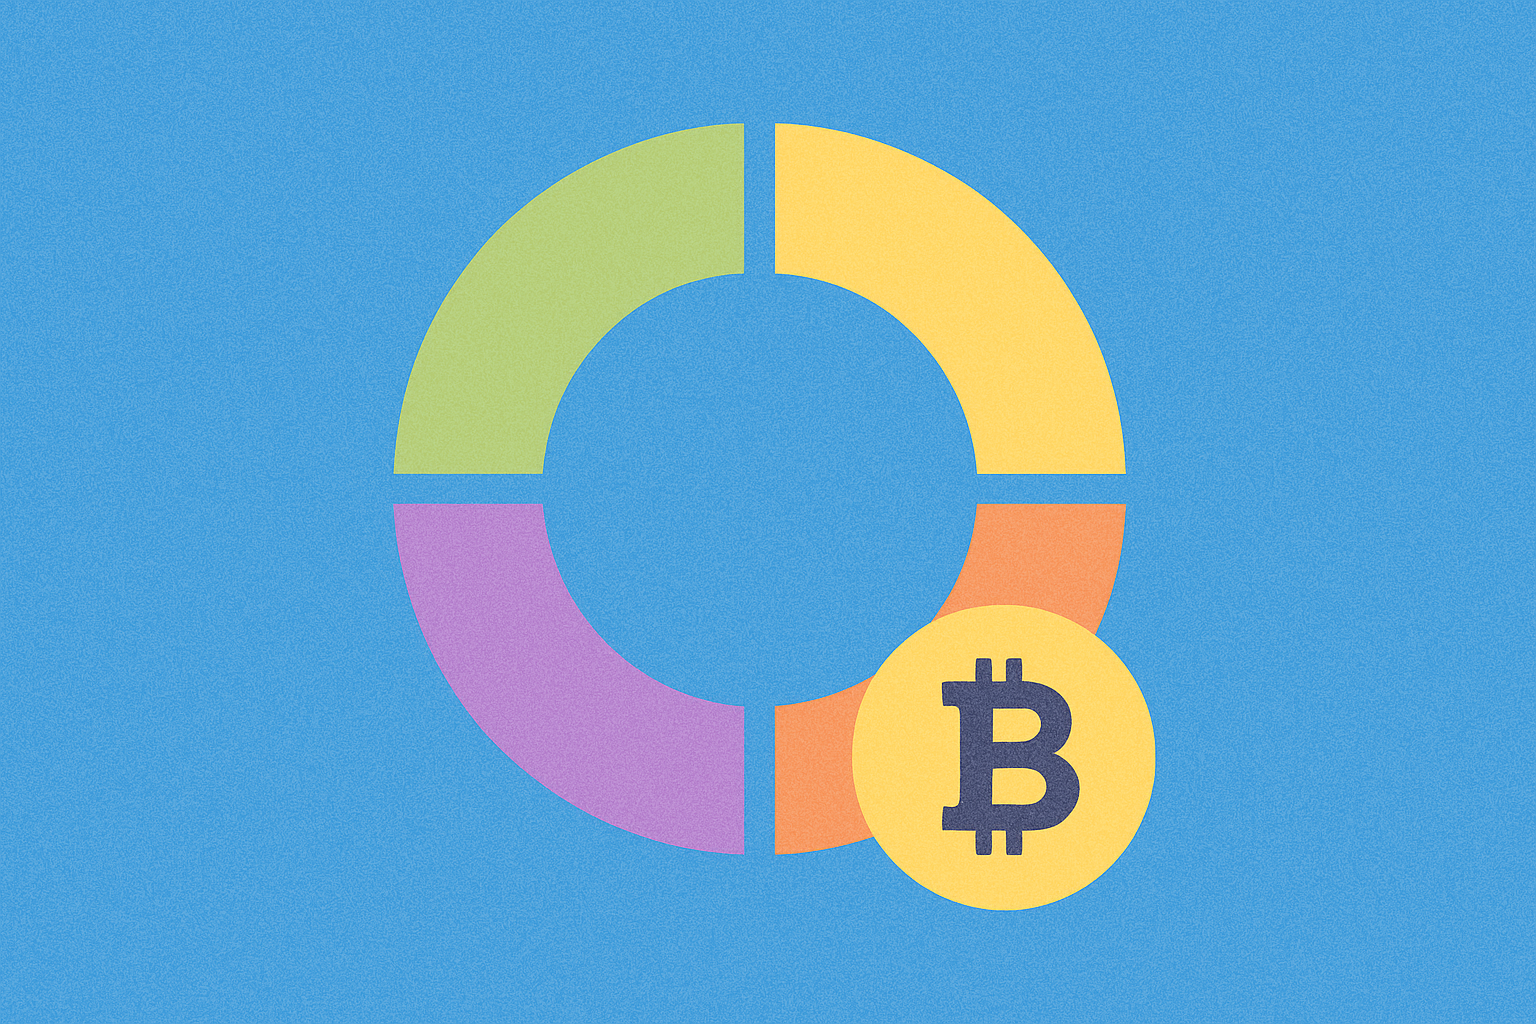
# The Crypto Carousel: Explaining Cryptocurrency Cycles
The cryptocurrency market, while known for its volatility and unpredictability, may follow certain patterns that some traders believe reflect natural market rhythms. This phenomenon, known as crypto cycle theory, suggests that beneath the surface of seemingly random price movements lies a predictable structure driven by market dynamics and trader psychology. Understanding these cycles has become an essential tool for many traders seeking to optimize their entry and exit positions in the digital asset market, particularly when navigating through periods commonly referred to as crypto winter history.
## Understanding crypto market cycles
Crypto market cycles represent observable long-term patterns in price movements and trading behaviors across the cryptocurrency ecosystem. These cycles are identified through careful analysis of historical price data combined with fundamental principles of trading psychology. Traders who study these patterns look for correlations between past and present market conditions to forecast potential future scenarios.
The core principle behind crypto cycle theory is that regardless of external economic factors or breaking news, cryptocurrencies tend to move through predictable phases characterized by distinct market behaviors and sentiment shifts. Each phase exhibits unique characteristics in terms of price action, trading volume, and investor psychology. By recognizing these patterns, traders attempt to position themselves advantageously for different market conditions.
Proponents of this theory argue that while history doesn't guarantee future outcomes, the recurring nature of these cycles provides a framework for understanding market dynamics. This seasonality in cryptocurrency markets manifests through four distinct phases, each marking a transition in market sentiment from extreme pessimism to euphoria and back again. Understanding crypto winter history has become particularly important for long-term investors who seek to identify optimal accumulation periods.
## The purported four phases of a crypto cycle chart
The crypto market cycle theory identifies four major phases that digital assets typically progress through. Each phase has distinct characteristics that help traders assess current market conditions and adjust their strategies accordingly.
The first phase, known as consolidation or accumulation, represents the quietest period in the crypto cycle. This phase follows significant price declines and is characterized by minimal trading activity, tight price ranges, and limited media attention. Often referred to as "crypto winter," this period sees prices at their lowest levels with pervasive pessimism throughout the market. Examining crypto winter history reveals that these periods, while psychologically challenging, have historically presented significant opportunities. Long-term investors often view this as an opportunity to acquire assets at discounted prices, building positions for future appreciation. Notable examples from crypto winter history include the extended bear markets of 2014-2015 and 2018-2019, where prices remained suppressed for extended periods before eventual recovery.
The second phase, called the markup phase, marks the transition from pessimism to optimism. During this period, the market begins to recover as more traders enter positions, reflected in higher trading volumes and upward price trends. This phase often follows positive news events or significant network upgrades, though the exact catalyst isn't always clear. A notable characteristic of this phase is the prevalence of FOMO (fear of missing out), which can drive irrational trading behavior as prices reach new highs.
The third phase, distribution, represents a critical turning point where early investors begin taking profits while new participants continue entering the market. Prices typically remain elevated but show less dramatic growth compared to the markup phase. This creates a standoff between buyers hoping for further gains and sellers looking to secure profits. The market becomes increasingly uncertain as traders debate whether the bull run has more momentum or is nearing exhaustion.
The fourth and final phase, markdown, occurs when selling pressure overwhelms buying interest. Prices decline sharply, and market sentiment shifts from cautious to panicked. Fear, uncertainty, and doubt dominate this period, often accompanied by negative headlines and market scandals. As the selling pressure subsides and most participants exit their positions, trading volumes decrease, and prices stabilize at lower levels, setting the stage for a new consolidation phase and potentially another chapter in crypto winter history.
## How long do crypto cycles last?
While crypto cycles don't follow a fixed schedule, many traders observe a recurring four-year pattern in cryptocurrency markets. This theory suggests that the complete progression through accumulation, markup, distribution, and markdown phases occurs within approximately four years, and crypto winter history provides considerable support for this timeframe.
A significant factor influencing this four-year cycle is [Bitcoin](https://www.gate.com/zh/trade/BTC_USDT)'s halving event, which occurs roughly every four years. During a halving, Bitcoin's inflation rate is cut in half, and miners receive 50% fewer BTC rewards for validating transactions. Given Bitcoin's dominant position as the largest cryptocurrency by market capitalization, these halvings significantly impact overall market sentiment and behavior.
Crypto winter history shows notable patterns following Bitcoin halvings that occurred in 2012, 2016, and 2020. For example, the bull market that peaked in late 2017 saw Bitcoin reach nearly $20,000 per coin before entering a prolonged bear market that lasted through 2018 and much of 2019. The market didn't achieve new highs until the 2020-2021 bull run, roughly four years later. More recently, following the 2020 halving, the market experienced another significant bull run before entering a consolidation period. The most recent halving occurred in 2024, and historical patterns suggest potential market developments in the subsequent periods. However, while this correlation is compelling, debate continues over whether this pattern will reliably repeat and how strong the causal relationship truly is between halvings and market cycles.
## How to identify a crypto market cycle
Identifying the current phase of a crypto market cycle requires careful analysis of multiple indicators and tools. While perfect foresight is impossible, traders use various metrics to make educated assessments about market conditions and potential opportunities, drawing valuable lessons from crypto winter history.
The Bitcoin halving cycle chart serves as a primary tool for many traders. Whether halvings directly cause bull runs or simply create self-fulfilling prophecies through market expectations, these events significantly influence crypto market psychology. Historical patterns from crypto winter history show markup phases typically beginning within a year after halvings, followed by multi-year consolidation periods.
The Bitcoin dominance chart measures Bitcoin's market capitalization relative to the total crypto market, indicating the percentage of capital allocated to BTC versus altcoins. Higher Bitcoin dominance often suggests a risk-off environment characteristic of markdown or consolidation phases, as traders seek the relative safety of the most established cryptocurrency. Conversely, declining Bitcoin dominance may indicate a risk-on environment typical of markup or distribution phases, as capital flows into more speculative altcoins. Crypto winter history demonstrates that Bitcoin dominance tends to increase during bear markets as investors retreat to perceived safety.
Average trading volume provides crucial insights into market activity levels. Volume bars displayed at the bottom of price charts show daily trading amounts for digital assets. Rising volume typically accompanies volatile phases like markup or markdown, while diminished volume and narrow price ranges correlate with consolidation and distribution periods. Reviewing crypto winter history reveals that trading volumes typically decline significantly during prolonged bear markets.
The Crypto Fear and Greed Index, created by Alternative.me, aggregates multiple metrics including price volatility, social media sentiment, and Bitcoin dominance to gauge overall market sentiment. This index assigns daily scores from 0 to 100, with 0 representing extreme fear and 100 indicating extreme greed. While not scientifically rigorous, it helps traders understand prevailing market emotions and identify potential entry or exit opportunities. During periods that later became part of crypto winter history, this index consistently showed extreme fear readings for extended periods.
Additionally, traders can analyze their positions through various centralized trading platforms and decentralized protocols, each offering different tools and perspectives for understanding market cycles. The choice of platform depends on individual preferences for security, features, and trading options.
## Conclusion
Crypto market cycles represent a framework for understanding the recurring patterns of boom and bust in cryptocurrency markets. While debate continues over the predictive power and scientific validity of cycle theory, crypto winter history and historical patterns provide valuable context for traders navigating volatile digital asset markets. The four-phase cycle model—encompassing consolidation, markup, distribution, and markdown—offers a structured approach to analyzing market dynamics and trader psychology.
The correlation between Bitcoin halvings and subsequent bull markets, combined with tools like dominance charts, volume analysis, and sentiment indicators, provides traders with multiple perspectives for assessing current market conditions. Lessons drawn from crypto winter history emphasize the importance of patience, risk management, and emotional discipline during extended bear markets. However, it's crucial to remember that these patterns don't guarantee future outcomes, and markets can deviate from historical norms due to unprecedented events or changing market structures.
Ultimately, whether crypto cycles are driven by fundamental market mechanics or function as self-fulfilling prophecies, understanding these patterns—including the valuable lessons from crypto winter history—remains a valuable component of cryptocurrency market analysis. Traders who combine cycle theory with comprehensive risk management and diverse analytical tools position themselves to navigate the crypto market's characteristic volatility more effectively, regardless of which phase the market currently occupies. By studying crypto winter history, investors can better prepare psychologically and strategically for inevitable market downturns while maintaining perspective on long-term opportunities.
## FAQ
### How many crypto winters have there been?
There have been four major crypto winters up to 2025. Each was triggered by different events, including exchange hacks, ICO collapse, and stablecoin failures.
### Is December a good month for crypto historically?
Yes, December has historically been a strong month for crypto. Bitcoin has averaged a 9.2% gain in December since 2014, making it one of the most favorable months for cryptocurrency performance.
### What happens during a crypto winter?
During a crypto winter, cryptocurrency prices plummet, trading volume decreases, and market activity slows. Investors face losses, projects struggle, and the industry experiences a prolonged downturn.
### How long do crypto winters last?
Crypto winters typically last from three months to several years, with their duration varying based on market conditions and external factors.
* The information is not intended to be and does not constitute financial advice or any other recommendation of any sort offered or endorsed by Gate.
Related Articles

Understanding Bitcoin's Supply Limit: How Many Bitcoins Exist?
The article delves into Bitcoin's finite supply of 21 million coins, shedding light on its implications for the cryptocurrency ecosystem. It explores how Bitcoin's halving mechanism controls supply, impacting mining rewards and inflation. The piece also discusses what happens after all coins are mined, the role of transaction fees, and introduces the Lightning Network's innovation for scalability. Addressing the loss and theft of bitcoins, it highlights security challenges and advancements. Ideal for crypto enthusiasts and investors, the article explains Bitcoin's value proposition rooted in scarcity and decentralization.
2025-12-04

What is XRP vs SWIFT: How does Ripple's cross-border payment solution compare to legacy financial systems?
The article compares Ripple's XRP-based payment solution to SWIFT's longstanding financial system, emphasizing technological advancements and efficiency. It discusses Ripple's rapid transaction speed and low costs, contrasting SWIFT's traditional processes. The piece addresses cross-border payment issues, appealing to financial institutions seeking modern alternatives. Structured into sections on market dominance, performance metrics, and control disparities, it highlights Ripple's innovation against SWIFT's established infrastructure. Key themes include cross-border payments, transaction speed, and financial technology, optimizing readability and relevance for industry professionals.
2025-12-21
What is Dogecoin (DOGE) market overview - price, market cap, and 24-hour trading volume
The article provides a detailed market overview of Dogecoin (DOGE), focusing on its current price, market cap, and significant trading volume activities. As of December 26, 2025, Dogecoin holds an $18.87 billion market cap with a trading price of $0.1239, showing resilience amidst market volatility. It highlights the recent surge in 24-hour trading volume, reaching $1 billion driven by increased trading activities. Moreover, it discusses the role of Dogecoin's circulating supply of 152 billion coins in maintaining robust liquidity across major exchanges like Gate, making it a favorable choice for traders and investors seeking high-volume transaction capacity. The article is structured to provide insights into market dynamics, trading patterns, and liquidity factors, targeting cryptocurrency enthusiasts and investors. Key themes focus on Dogecoin's market position, trading behaviors, and liquidity strengths.
2025-12-26
What is the global crypto market overview in 2026: market cap rankings, trading volume, and liquidity analysis?
# Global Crypto Market Overview in 2026: Market Cap Rankings, Trading Volume, and Liquidity Analysis
This comprehensive analysis examines the 2026 cryptocurrency landscape, revealing how Bitcoin and Ethereum maintain dominant positions through institutional adoption and regulatory clarity. The article provides essential market intelligence covering multi-trillion-dollar valuations, daily spot trading volumes exceeding $100 billion across major exchanges including Gate, and circulation supply dynamics across 500+ trading platforms. Designed for institutional investors, crypto analysts, and market participants, this guide addresses critical questions about market cap rankings, liquidity infrastructure, and emerging asset distribution across North America, Europe, and Asia. By analyzing stablecoin infrastructure, exchange coverage rates, and trading volume metrics, readers gain actionable insights into 2026's institutional-grade crypto market maturity. The article progresses logically from market dominance asse
2026-01-02

What Are the Regulatory and Compliance Risks in Cryptocurrency Markets: SEC Standards and KYC/AML Requirements Explained
# Article Introduction
This comprehensive guide explores critical regulatory and compliance risks in cryptocurrency markets, focusing on SEC standards and KYC/AML requirements. It addresses compliance challenges faced by crypto exchanges, trading platforms, and digital asset businesses operating on Gate and other regulated environments. The article examines the SEC's evolving regulatory framework, multi-layered compliance obligations across FinCEN and CFTC, and practical KYC/AML implementation strategies. Key topics include governance frameworks, audit transparency metrics, transaction monitoring systems, and risk management protocols essential for regulatory adherence. Designed for compliance officers, exchange operators, and crypto businesses, this resource provides actionable insights to strengthen compliance infrastructure, mitigate enforcement risks, and maintain regulatory certainty in dynamic digital asset markets.
2025-12-27

Guide: Assessing Liquidity in Cryptocurrency Markets
# Guide: Assessing Liquidity in Cryptocurrency Markets
This comprehensive guide explains how to evaluate cryptocurrency liquidity through trading volume analysis, order book depth, and bid-ask spreads using tools like CoinMarketCap, CoinGecko, and Gate APIs. Designed for traders, investors, and DeFi users, it demonstrates why high liquidity ensures stable prices, faster transactions, and lower costs while low liquidity creates volatility risks. The article examines real-world applications across major exchanges, liquidity aggregators, and Automated Market Makers, supported by empirical data showing top cryptocurrencies command 80% of market liquidity. By mastering liquidity assessment techniques through Gate and other platforms, stakeholders can make informed decisions, optimize trading efficiency, and navigate crypto markets with greater confidence and reduced slippage exposure.
2025-12-27
Recommended for You
What is BULLA coin: analyzing whitepaper logic, use cases, and team fundamentals in 2026
BULLA coin introduces decentralized accounting and on-chain data management innovation built on BNB Smart Chain, eliminating intermediaries while ensuring real-time transaction verification. The platform addresses critical gaps in cryptocurrency infrastructure by embedding accounting logic directly into smart contracts, enabling transparent audit trails and regulatory compliance. Real-world applications include seamless transaction imports across multiple exchanges, comprehensive crypto portfolio tracking, and secure record-keeping for investors. Trade import tools enhance user experience by automating data categorization and consolidation. Founded in 2021 by blockchain architect Benjamin with support from experienced fintech designers and engineers, BULLA Networks demonstrates active development momentum with continuous smart contract iterations through early 2026. The 2026-2027 strategic roadmap prioritizes network infrastructure expansion and enhanced security protocols, positioning BULLA as a robust decen
2026-02-08

What is on-chain data analysis and how does it reveal whale movements and active addresses in crypto?
On-chain data analysis reveals cryptocurrency market dynamics by examining active addresses and transaction metrics that expose whale movements and investor behavior. This comprehensive guide explores how blockchain data serves as a critical market indicator, demonstrating the correlation between large holder activities and price movements—such as FLOKI's 950% surge in whale transactions. The article covers whale movement tracking, holder distribution patterns showing 73.47% concentration among major stakeholders, and on-chain fee trends as cycle indicators. Essential metrics include active addresses reflecting genuine network participation, transaction volumes revealing strategic positioning, and network congestion patterns during market cycles. By tracking these interconnected indicators through platforms like Glassnode and Gate, investors and traders can identify market sentiment shifts, anticipate price movements, and distinguish institutional activity from retail participation, making on-chain analysis i
2026-02-08

What is Vodra (VDR) crypto: whitepaper logic, use cases, and fundamentals analysis for 2026
Vodra (VDR) is a decentralized blockchain platform revolutionizing creator economics through AI-powered infrastructure and transparent compensation systems. The project addresses the creator economy's core challenge—unfair intermediary-controlled monetization—by enabling direct audience-to-creator transactions without traditional gatekeepers. VDR's whitepaper establishes a dual-layer architecture combining artificial intelligence for content assistance with blockchain verification for security and transparency. The platform's real-world applications extend from content monetization to DeFi ecosystem integration, real-world asset tokenization, and AI-driven automation by 2026. Founded by former Google engineer Yu Hu with backing from prominent investors like Dragonfly and The Spartan Group, Vodra positions itself at the intersection of Web3 infrastructure and creator empowerment. Key acquisition channels include Gate and other decentralized exchanges, with development roadmaps targeting API standardization, en
2026-02-08
How do cryptocurrency competitors compare in market share, performance, and user adoption in 2026?
This comprehensive analysis examines how major cryptocurrency competitors diverge across market share, performance, and user adoption in 2026. Bitcoin maintains dominance above 60% while institutional investors adopt core-satellite portfolios allocating 60-80% to Bitcoin and 15-25% to Ethereum. Layer-2 solutions command a decisive 40% market share advantage over legacy networks, with Solana leading at 1,133 TPS and driving institutional TVL beyond $50 billion. Regional adoption varies dramatically: Asia-Pacific accelerates at 11.6% CAGR driven by digital transformation, while North America concentrates 75% institutional users. Trading activity concentrates on Gate and leading platforms, with top five cryptocurrencies maintaining 61% combined market share. Understanding these divergent trajectories is essential for investors navigating competitive positioning and institutional capital flows.
2026-02-08

What is on-chain data analysis and how does it predict crypto market trends
This comprehensive guide explores on-chain data analysis as a foundational tool for predicting cryptocurrency market trends. The article examines how blockchain metrics—including active addresses, transaction volume, and network health—reveal genuine market sentiment beyond price action alone. Key sections analyze whale movements as reliable leading indicators of market direction, demonstrating how large holder distribution patterns expose institutional positioning before broader price shifts occur. The guide further demonstrates how gas fee trends and network congestion serve as real-time sentiment gauges across different blockchain architectures. By tracking these on-chain indicators on platforms like Gate, traders can identify market opportunities before mainstream recognition. The article emphasizes that while on-chain analysis provides measurable predictive value through transaction flow analysis and holder behavior patterns, it functions best as a complementary tool alongside other market analysis metho
2026-02-08
How Does VeChain (VET) Community and Ecosystem Activity Compare to Other Layer 1 Cryptocurrencies in 2026?
This comprehensive analysis examines VeChain's community and ecosystem activity relative to competing Layer 1 blockchains in 2026. The article evaluates VeChain's multimillion-follower social infrastructure across Discord and Telegram, extensive developer ecosystem featuring 5,000+ DApps, and robust on-chain metrics with 2.5 million daily active addresses. Key findings highlight VeChain's enterprise-grade differentiation through supply chain solutions, institutional partnerships with Fortune 500 organizations, and proven real-world applications. While VeChain demonstrates lower developer numbers than Ethereum and Solana, its focused positioning in enterprise adoption, regulatory compliance through MiCA alignment, and strategic partnerships with DNV and Boston Consulting Group establish competitive advantages in B2B blockchain adoption, positioning VET as a distinctive Layer 1 leader within enterprise-centric ecosystems.
2026-02-08